How To provisioning Dashboards in Grafana
Grafana is a nice hand tool, after the first setup, you will have a nice empty system that you can configure on your own. But since we are all living in a DevOps world, you must find a solution to pre-provision a Dashboard that matches your needs.
Let’s assume you are running a Kubernetes, that is provisioning some microservices. These services will provide some metrics that will be fetched by Prometheus and these will be displayed by grafana. Now you want a nice fancy dashboard, but every time when grafana will is or you setup another system, you get an empty dashboard. In this post, you will learn how you can deliver a predefined dashboard on the DevOps way.
The base setup
First of all, you must create a Grafana instance my Kubernetes definition looks like the following:
This will create a plain Grafana instance without saving any data into the monitoring namespace. So the next step is to create a data source definition for your Prometheus source. That will be provisioned with grafana too.
Create the Datasource definition
For the Datasource, we create a configMap into our Kubernetes server. This will hold the configuration file for us in a centralized place. The config for the Prometheus data source looks like this:
In this, my Prometheus is running into the service port called prometheus-service.monitoring . This Datasource will be not editable so that now the user can`t accidentally misconfigure it.
The next step is to configure a small dashboard that will apply some data from our Prometheus instance.
Dashboard definition
My Dashboard definition will be configured as configMap too and looks like this:
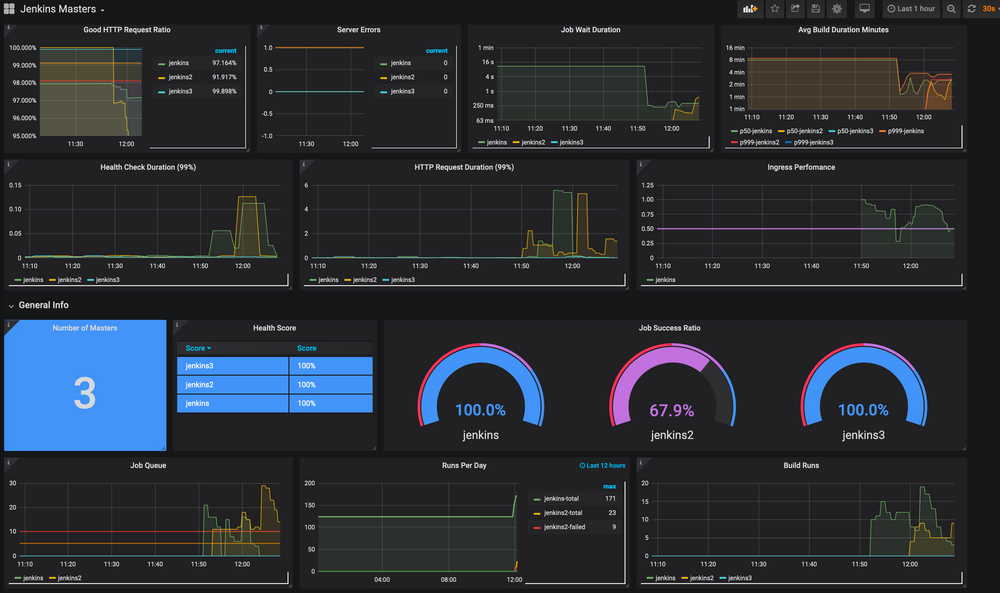
This will display some metrics depending on my grafana inputs. This will be only for example how to use it. I will later show you, how to define and export a Grafana dashboard.
For now, you have a Dashboard definition, but Grafana does not know that there exists a dashboard. For this, you must define a grafana config.
Define a Grafana Configuration
Let’s create a dashboard definition
This will tell grafana that it will look every 10 seconds into the path /var/lib/grafana/dashboards and check if there is a new dashboard definition.
So for now we have the ability to store our dashboard definition into this path and it will work for now. So the next step is to apply the created configMap to our grafana instance.
Adding Volumemounts
Let's modify the base Grafana definition above, and add the volume mounts we need.
You will add three volumes
- grafana-datasources
- grafana-dashboard
- grafana-dashboard-defintion
The grafana-datasources will map to our data sources. The grafana-dashboarddef will map onto our dashboard definition. Finally, the grafana-dashboard will be mapped onto the dashboard itself.
At this point, the position where your files will be mounted is important. The Dashboard definition must be mounted in the folder /etc/grafana/provisioning/dashboards. As defined in the dashboard definition, the dashboard itself must be mounted /var/lib/grafana/dashboards, because this folder will be monitored. To let the dashboard fetch the right data, you must store the data source configuration under the path /etc/grafana/provisioning/datasources .
For reference, here is my complete modified template
Now, when you apply the dashboard, you will see at the dashboard selection your configured dashboard is connected to your data source.
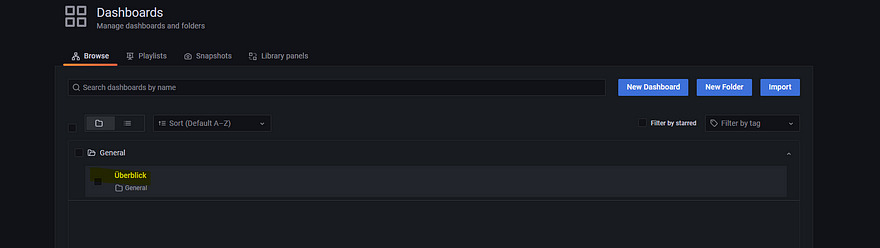
Get the Dashboard Json
As you can see, you will import a JSON for your dashboard definition. So How do you get this definition? That’s very simple, create a Dashboard in your Grafana system. After that, you must go to the dashboard settings.

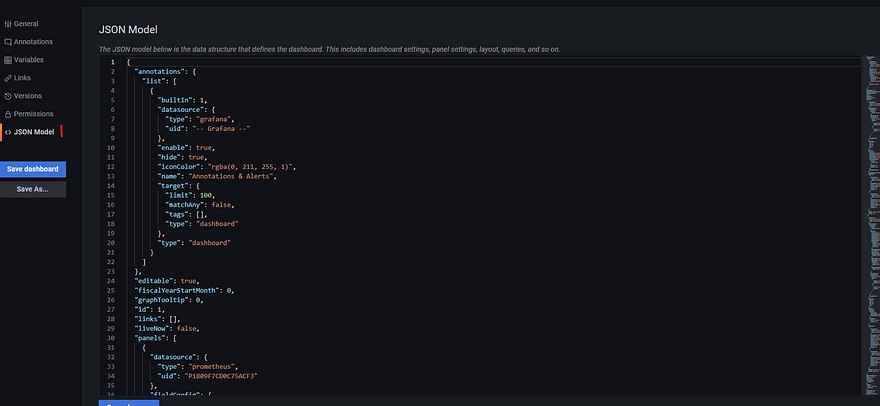
After that, you must navigate through the Tab Json Model and there you will get the JSON definition that you can use to provide this dashboard.
Final thoughts
In this post, I offered you my simple provisioning technique on how to pre-provisioning a dashboard into my Grafana instance. In a DevOps world, it will be necessary to get not only an infrastructure as a code deployment, but it must come with a configuration too.
What are your thoughts? How do you provision a dashboard like this?